
A PageSpeed Insights report has two parts: field data from real Chrome users over the previous 28 days, which decides whether a page passes Core Web Vitals, and lab data from a single Lighthouse test, which produces the 0–100 performance score. For SEO, read the field data first; Google’s ranking systems use Core Web Vitals, not the Lighthouse score.
Key takeaways
- Field data comes from the Chrome UX Report (CrUX) and covers the previous 28 days; PageSpeed Insights shows the 75th percentile of real visits.
- A page passes Core Web Vitals when the 75th percentile of LCP (≤ 2.5 s), INP (≤ 200 ms) and CLS (≤ 0.1) are all Good.
- The Lighthouse score is a weighted mix of five lab metrics: Total Blocking Time 30%, LCP 25%, CLS 25%, First Contentful Paint 10% and Speed Index 10%.
- Google’s John Mueller said in 2021 that Google “doesn’t use the X/100 lighthouse score for search,” and uses Core Web Vitals separately.
- In the Web Almanac 2025, 48% of websites passed all Core Web Vitals on mobile and 56% on desktop, up from 32% and 41% in 2021.
What are the two halves of a PageSpeed Insights report?
Google’s About PageSpeed Insights documentation (last updated Oct 21, 2024) describes field data as “a historical report about how a particular URL has performed,” and lab data as “a simulated load of a page on a single device and fixed set of network conditions.” The report shows both, one above the other, for mobile and desktop.
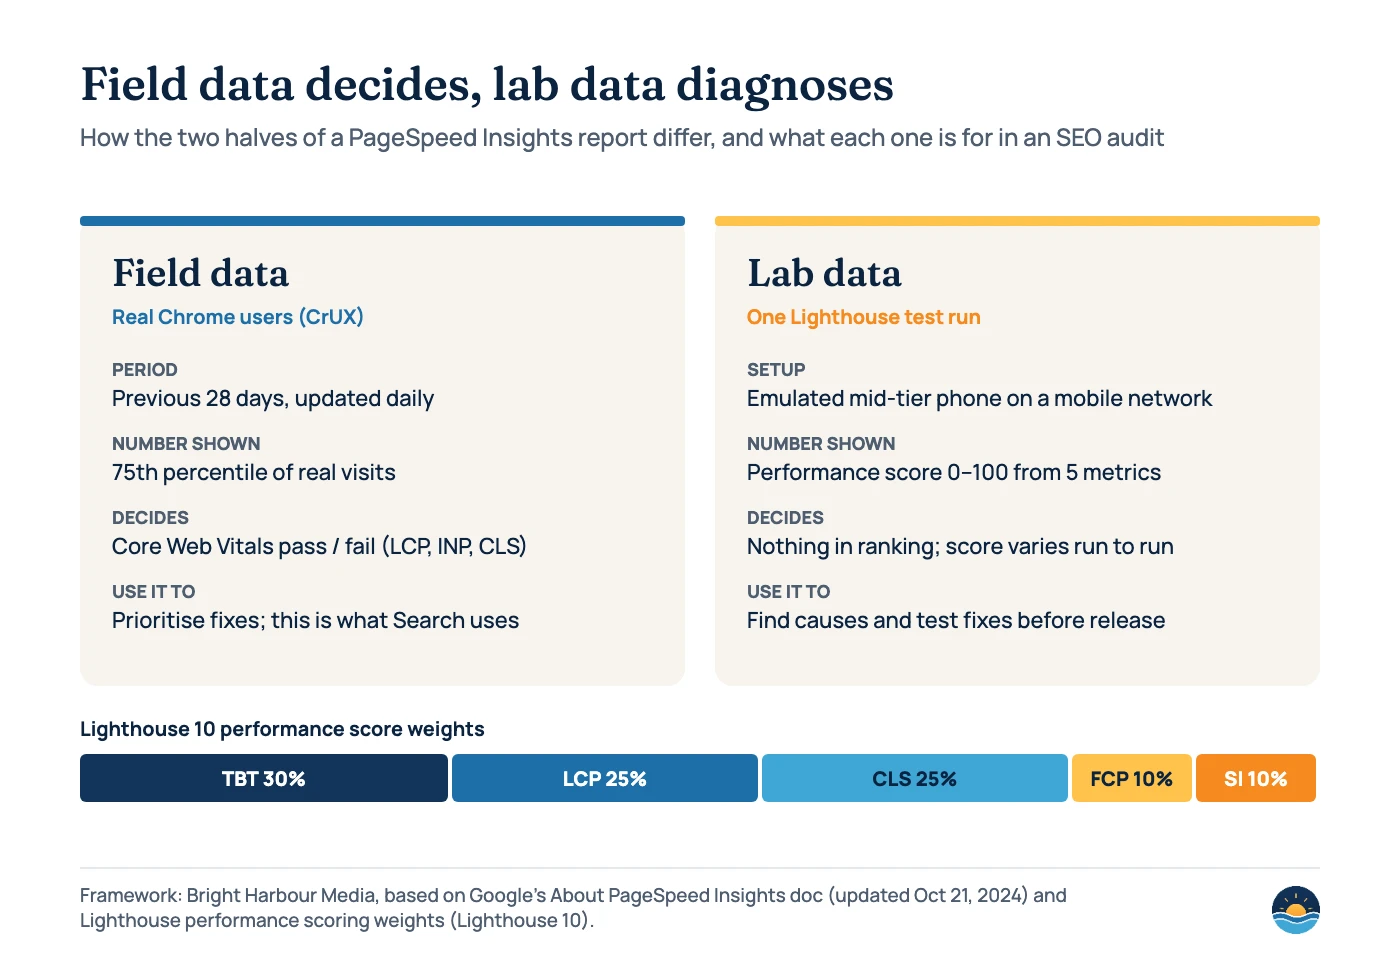
| Field data (top of the report) | Lab data (Lighthouse, lower down) | |
|---|---|---|
| Source | Chrome UX Report: opted-in Chrome users | One simulated page load run by Lighthouse |
| Time window | Previous 28 days, updated daily | The moment you click Analyze |
| Headline number | 75th percentile for each metric | Performance score 0–100 |
| Metrics | LCP, INP, CLS (Core Web Vitals), plus FCP and experimental TTFB | FCP, Speed Index, LCP, Total Blocking Time, CLS |
| Device | Real phones and computers your visitors use | Mobile: emulated mid-tier device (Moto G4) on a mobile network; desktop: emulated desktop on a wired connection |
| Used by Google Search? | Yes, CrUX informs the page experience signals | No, the score is not used for ranking |
How do you read the field data section?
Start with the Core Web Vitals assessment at the top. Each metric shows a distribution bar (green, amber, red) and a single value, which is the 75th percentile. Google chose that percentile “so that developers can understand the most frustrating user experiences on their site.” In Google’s own example, 11% in LCP’s amber bar means 11% of observed LCP values fell between 2,500 ms and 4,000 ms.
| Metric | Good | Needs improvement | Poor | Core Web Vital? |
|---|---|---|---|---|
| Largest Contentful Paint (LCP) | ≤ 2,500 ms | 2,500–4,000 ms | > 4,000 ms | Yes |
| Interaction to Next Paint (INP) | ≤ 200 ms | 200–500 ms | > 500 ms | Yes (replaced FID on Mar 12, 2024) |
| Cumulative Layout Shift (CLS) | ≤ 0.1 | 0.1–0.25 | > 0.25 | Yes |
| First Contentful Paint (FCP) | ≤ 1,800 ms | 1,800–3,000 ms | > 3,000 ms | No |
| Time to First Byte (TTFB) | ≤ 800 ms | 800–1,800 ms | > 1,800 ms | No (experimental) |
The pass/fail rules are precise. With enough data for all three metrics, a page passes “if the 75th percentiles of all three metrics are Good.” If INP has too little data, it passes when LCP and CLS are both Good. If LCP or CLS lacks data, the assessment “cannot be assessed.”
Then check the toggle between This URL and Origin. When a single page does not have enough traffic, PageSpeed Insights falls back to origin-level data, which covers every page on the site. That is useful context, but it is not a verdict on the page you tested. Our Core Web Vitals guide explains each metric in more depth.
Why does PageSpeed Insights say “no data” for some pages?
CrUX only includes pages and origins that are publicly discoverable and popular enough. According to Chrome’s CrUX methodology (updated Jun 20, 2024), a page is excluded if it returns a non-200 status or carries a noindex in the meta robots tag or X-Robots-Tag header. The popularity threshold is not disclosed, and you cannot submit pages manually.
Data also comes only from Chrome users who have opted in to usage statistics and sync, on desktop and Android. Chrome on iOS, Android WebView and other Chromium browsers such as Edge are not included. Query strings are stripped, so ?utm_source= variants roll up into the clean URL. For a small business site, origin-level data or no field data at all is normal; it does not mean anything is broken.
How do you read the Lighthouse performance score?
The lab section runs Lighthouse once and reports a performance score with three bands: 90 or above is good, 50 to 89 needs improvement and below 50 is poor. According to Chrome’s Lighthouse scoring documentation, the score is “a weighted average of the metric scores,” and only metrics count: “not the results of Opportunities or Diagnostics.”
| Lab metric | Weight in Lighthouse 10 | Closest field metric |
|---|---|---|
| Total Blocking Time (TBT) | 30% | INP (TBT is a lab stand-in for responsiveness) |
| Largest Contentful Paint (LCP) | 25% | LCP |
| Cumulative Layout Shift (CLS) | 25% | CLS (lab only measures shifts during load) |
| First Contentful Paint (FCP) | 10% | FCP |
| Speed Index (SI) | 10% | None |
Each metric is scored against a curve built from real-site data in HTTP Archive: the 25th percentile of sites maps to a score of 50 and the 8th percentile to 90. That makes the top end hard to reach. Chrome’s documentation says a perfect 100 “is extremely challenging to achieve and not expected,” and that going from 99 to 100 needs about the same metric improvement as going from 90 to 94.
Scores also move between runs. Chrome lists A/B tests, ad changes, internet routing, device differences, browser extensions and antivirus software as causes, and recommends thinking of performance “as a distribution of scores, rather than a single number.” Run a test three to five times before reporting a lab number.
Does the PageSpeed Insights score affect rankings?
Not the 0–100 score. Google’s page experience documentation (updated Sep 22, 2026) says “Core Web Vitals are used by our ranking systems” and that “There is no single signal.” It adds that good results do not guarantee top rankings and that “trying to get a perfect score just for SEO reasons may not be the best use of your time.” Google “always seeks to show the most relevant content, even if the page experience is sub-par.”
On the score itself, John Mueller wrote on Reddit (reported by Search Engine Journal on Oct 29, 2021) that “Google doesn’t use the X/100 lighthouse score for search, we use the core web vitals separately,” and in August 2021 that “Lighthouse scores do not affect Google Search.” Both statements predate INP replacing FID, but nothing Google has published since says the Lighthouse score is used.
Report this in an audit
- Core Web Vitals pass/fail from field data, mobile first
- Which metric fails and its 75th percentile value
- Whether the data is URL-level or origin-level
- Search Console Core Web Vitals report groups that match
Don’t lead with this
- A single Lighthouse score, especially below 100 but in the green
- Opportunities that save a few milliseconds
- Desktop scores when most visitors use phones
- Comparisons with competitors’ one-off lab scores
How does your site compare with the web?
The HTTP Archive Web Almanac 2025 Performance chapter (published Jan 15, 2026, using CrUX data from July 2025) gives useful benchmarks. Mobile pass rates have risen every year since 2022, while desktop barely moved in 2025.
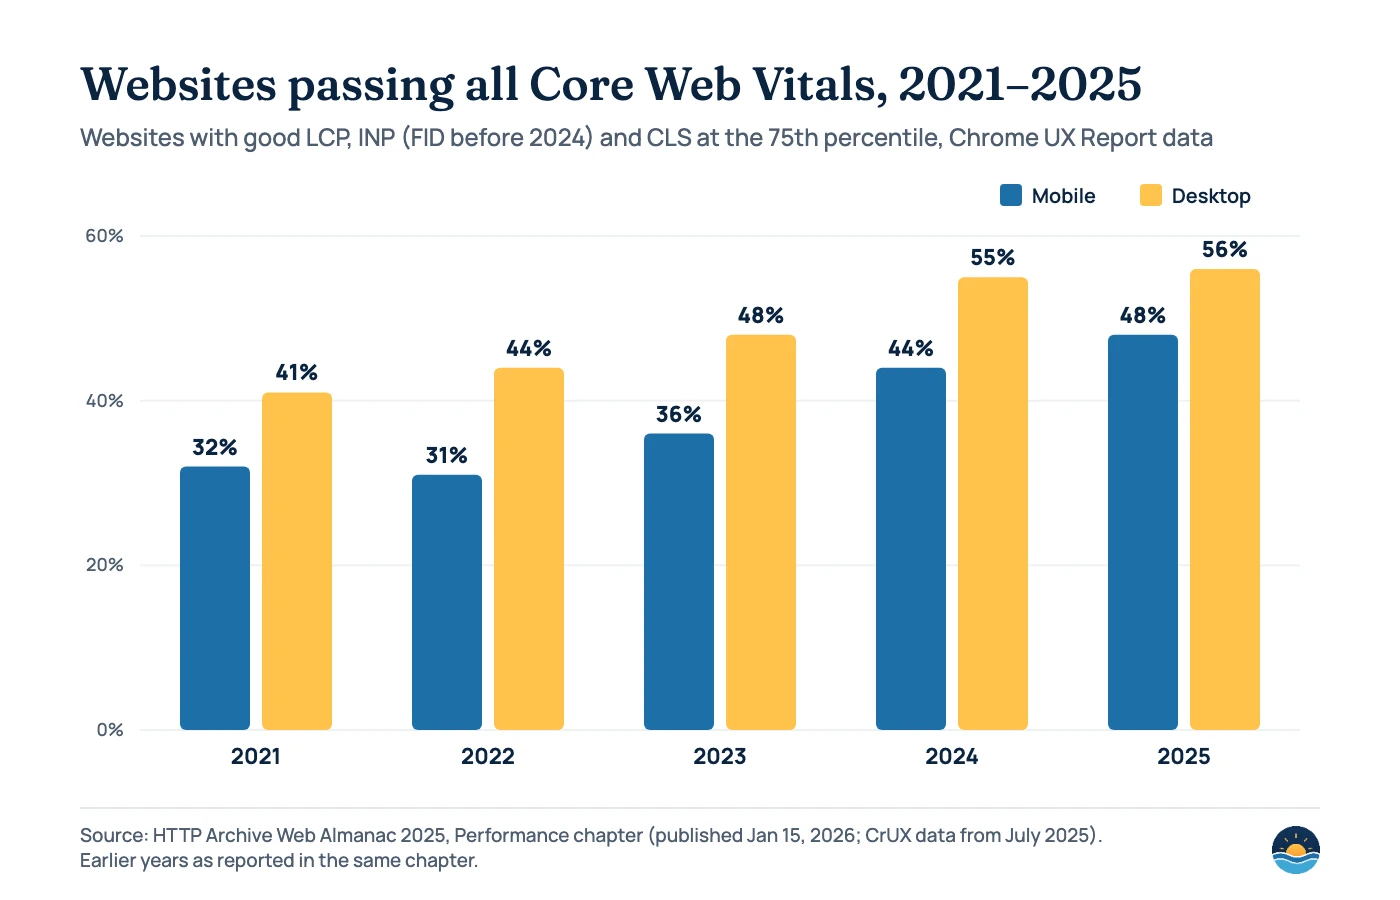
In 2025, 62% of mobile sites had good LCP, 77% good INP and 81% good CLS, so LCP is the metric most likely to fail. Secondary pages passed more often than home pages (56% vs 45% on mobile). Lab numbers tell a different story: median mobile Total Blocking Time rose from 1,209 ms in 2024 to 1,916 ms in 2025, even as real-user INP improved. That is a good example of why lab and field data should not be read as the same thing.
If you run WordPress, expect a modest lab score. The Web Almanac 2025 CMS chapter puts the median mobile Lighthouse performance score for WordPress at 41 (63 on desktop), and adds that “These lab scores are best read as context, not as a proxy for real-user experience.”
Why do lab and field data disagree?
web.dev’s article on lab and field data differences (updated Jul 18, 2022) lists the main reasons: real visitors use many devices, networks and locations; the LCP element can change with screen size, logins or A/B tests; lab tests start with a cold cache while returning visitors have files cached; and lab CLS only counts shifts above the fold during load, whereas field CLS covers the whole visit. INP needs real interactions, so “a page may have poor INP despite having very good TBT scores.”
Its advice is clear: “if you have both field data and lab data for a given page, field data is what you should use to prioritize your efforts.” Use lab data to find causes, such as large images, render-blocking scripts or heavy JavaScript, and to test fixes before they reach users. Our guides to image SEO and JavaScript SEO cover two of the most common causes.
A 7-step PageSpeed Insights check for an SEO audit
- Start in Search Console. Open the Core Web Vitals report, which uses CrUX data, groups similar URLs and gives each group the status of its worst metric. Pick a representative URL from each failing group.
- Test that URL on mobile first. Read the Core Web Vitals assessment and note which metric fails and its 75th percentile value.
- Check URL vs origin. Record whether the field data is for the page or the whole origin. If neither has data, rely on Search Console and lab tests.
- Run the lab test three to five times. Note the median score and the LCP element, rather than a single run.
- Match diagnostics to the failing metric. For LCP, look at the LCP element, server response and image size; for INP, long tasks and third-party scripts; for CLS, images without dimensions, ads and late-loading fonts.
- Prioritise by template. Fix the template behind a failing URL group, not one page at a time.
- Validate with field data. After deploying, use “Start Tracking” in Search Console, which runs a 28-day monitoring session, and check PageSpeed Insights again once the 28-day window has rolled over.
This sits alongside the other checks in our SEO audit checklist. Speed is one input; crawlability, indexing and content usually matter more.
Frequently asked questions
What is a good PageSpeed Insights score?
For the lab score, 90 or above is rated good, 50–89 needs improvement and below 50 is poor. For SEO, the more useful target is passing the Core Web Vitals assessment in field data: LCP at or under 2.5 seconds, INP at or under 200 ms and CLS at or under 0.1 at the 75th percentile.
Why is my PageSpeed score different every time?
Lighthouse runs one simulated load, and network routing, server load, ads and A/B tests change between runs. Chrome’s documentation recommends treating performance as a distribution of scores; run several tests and use the median.
Why does PageSpeed Insights show no field data?
The page or site is not in the Chrome UX Report, usually because it does not get enough eligible Chrome traffic, or because it is not publicly discoverable (for example, it returns an error or carries noindex). Google does not publish the traffic threshold.
Do I need a score of 100 to rank?
No. Google says the Lighthouse score is not used for search, and its page experience documentation warns that chasing a perfect score just for SEO “may not be the best use of your time.” Aim to pass Core Web Vitals for real users, then focus on content and relevance.
Sources
- About PageSpeed Insights — Google for Developers, updated Oct 21, 2024 — field and lab data, thresholds, assessment rules, score bands
- Lighthouse performance scoring — Chrome for Developers — Lighthouse 10 weights, scoring curve, variability
- Why lab and field data can be different (and what to do about it) — web.dev, updated Jul 18, 2022 — causes of differences, field data first
- Interaction to Next Paint is officially a Core Web Vital — web.dev, Mar 12, 2024 — INP replaced FID
- CrUX methodology — Chrome for Developers, updated Jun 20, 2024 — eligibility and which users are included
- Overview of CrUX — Chrome for Developers, updated Feb 8, 2024 — CrUX informs Google Search page experience
- Core Web Vitals report — Search Console Help — URL groups, worst-metric status, 28-day validation
- Understanding page experience in Google Search results — Google Search Central, updated Sep 22, 2026 — Core Web Vitals and ranking
- Understanding Core Web Vitals and Google search results — Google Search Central, updated Dec 10, 2025 — metric targets
- Web Almanac 2025: Performance — HTTP Archive, published Jan 15, 2026 — Core Web Vitals pass rates 2021–2025, TBT
- Web Almanac 2025: CMS — HTTP Archive, published Jan 15, 2026 — median Lighthouse scores by CMS
- Do Google Lighthouse Scores Affect SEO? — Search Engine Journal, Oct 29, 2021 — Mueller on the X/100 score
- Google’s Not Fooled By Fake Lighthouse Scores — Search Engine Journal, Aug 26, 2021 — “Lighthouse scores do not affect Google Search”
Cite this article: Bright Harbour Media. “How to Read a PageSpeed Insights Report for SEO.” Bright Harbour Media Insights, November 2026. https://brightharbourmedia.com/pagespeed-insights-report/
You are welcome to reference the charts and frameworks in this article with a link back to this page.
Not sure which speed problems are worth fixing? Our SEO audit service reads your field data, finds the templates that fail Core Web Vitals and ranks the fixes by impact. Get in touch to book an audit.